Categories
Archives
| M | T | W | T | F | S | S |
|---|---|---|---|---|---|---|
| 1 | 2 | 3 | 4 | |||
| 5 | 6 | 7 | 8 | 9 | 10 | 11 |
| 12 | 13 | 14 | 15 | 16 | 17 | 18 |
| 19 | 20 | 21 | 22 | 23 | 24 | 25 |
| 26 | 27 | 28 | 29 | 30 | 31 | |
Commentaries
APA January 2013 Commentary
By: niche / January 22nd, 2013
To quote: “The more things change the more they remain the same.”
As investors and politicians took a peek over the fiscal cliff at year end they didn’t like what they saw, or heard from America, and backed away. Unfortunately, the inability to reach common ground in Washington only prolonged the battle (don’t worry – no kick the can here) and delayed any tangible reform on deficits, debt and tax reform. Apparently the next big news from Washington comes over the next two months as Congress and the White House draw battle lines over raising the Federal Government’s “debt ceiling.”
But what Washington can’t solve, the markets may. In a Wall Street Journal Op-Ed on January 10th, George Melloan warned “…forget about the next Washington dog-and-pony show on the debt ceiling. The bond market will ultimately dictate the future of U.S. monetary and budget policy.” Markets do have a way of signaling solutions where Washington fails. And no politician wants to face their constituents following a collapse of the equity markets or a rush away from the U.S. Treasury markets.
As Mark Twain is reported to have said: “History may not repeat itself, but it rhymes a lot.” Thankfully, we believe markets do tend to rhyme a lot.
- The American Taxpayer Relief Act was passed by the Senate with a vote of 89 to 8 on January 1, 2012 and approved by the House on the same day by a vote of 257 to 167.
- Approval of the Act will usher in the largest tax increases in decades and is expected to have a major impact on the U.S. economy.
- The often discussed restrictions on the municipal bond tax exemption was not included in this Act, but observers say it could re-appear in the next few months as Congress and the White House try to find additional revenue sources to cover the growing Federal deficit.
- Bloomberg News reported that municipal bond debt was “best in asset class” in 2012. U.S. state and local debt returns exceeded those on equities, Treasuries, corporate bonds and commodities for the second straight year.
- Municipal Market Advisors reports that in 2012, there were 93 issuers who defaulted for the first time on approximately $1.7 billion in debt. This is a dramatic decrease from the 129 issuers who defaulted in 2011 on $6.5 billion in debt and the 140 issuers defaulting in 2010 on $3.16 billion in municipal debt.
- With the continuing troubles in the Eurozone, the debt debate in the U.S. market, and a flight to quality coupled with investor “yield grab”, U.S. Treasury rates continue to remain at historic lows into the New Year.
Fiscal Cliff Averted
The headlines welcoming investors in the New Year centered on the White House and Congress reaching a last minute budget deal temporarily averting the so-called “Fiscal Cliff.” The American Taxpayer Relief Act was passed by the Senate with a vote of 89 to 8 on January 1, 2012 and was then approved by the House on the same day by a vote of 257 to 167. President Obama signed the Act the very next day. The Act will usher in the largest tax increases in decades and is expected to have a major impact on the U.S. economy. Positively for municipal bond investors, the municipal bond tax exemption was not included in the Act, but could re-appear in the next few months as Congress tries to find additional revenue sources to cover the Federal Government’s growing budget deficits. The debt ceiling issue will also drive the next round of negotiations between Congress and the White House.
In total, the bill included $600 billion in new tax revenues to be collected over ten years, about one-fifth of which would have been raised anyway through previous agreements had no legislation been passed. Major tax changes include the following:
- Ratification of the Bush era tax cuts for middle income taxpayers but with an increase in the highest tax rate to 39.6% in 2013 from 35% in 2012 for individuals with incomes over $400,000 and families with incomes over $450,000.
- The top marginal tax rate on dividends and capitals gains was increased to 20% from the previous rate of 15% for the same high end taxpayers.
- A phase-out of tax deductions and credits for incomes over $250,000 for individuals and $300,000 for couples was reinstated. Limits on deductions had existed before the Bush tax cuts, and had expired in 2010.
- The Estate tax was increased to 40% on estates with values above $5.25 million (indexed for inflation), an increase from the 2012 rate of 35% on estates with values over $5.12 million
- Changes were made to the Alternative Minimum Tax (AMT) that will permanently index AMT to inflation, avoiding the annual “patch” that was previously required to prevent it from impacting middle-class families.
- The two-year old reduction in payroll taxes was not extended, increasing to 6.2% from 4.2%.
- The budget “sequestration,” created by the Budget Control Act of 2011 and requiring automatic cuts across the board for all Federal agencies, was delayed by two months, giving additional time for more negotiations on deficit reduction.
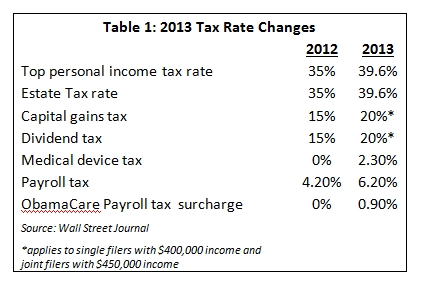
- Increased the ObamaCare health “surcharge” to 0.9% for taxpayers with income above $200,000 for singles and $250,000 for joint filers. (See Table 1.)
Table 1: 2013 Tax Rate Changes
2012 2013
Top personal income tax rate 35% 39.6%
Estate Tax rate 35% 39.6%
Capital gains tax 15% 20%*
Dividend tax 15% 20%*
Medical device tax 0% 2.30%
Payroll tax 4.20% 6.20%
ObamaCare Payroll tax surcharge 0% 0.90%
Source: Wall Street Journal
*applies to single filers with $400,000 income and joint filers with $450,000 income

Municipal Bonds were once again “best in asset class” in 2012
Bloomberg News reported that municipal bond debt was again rated “best asset class” in 2012 following the same rating in 2011. U.S. state and local debt returns exceed those on stocks, Treasuries, corporate bonds and commodities for the second straight year (when adjusted for volatility.) This was the longest winning streak for municipals since 2006. Investors were not dissuaded from investing in munis despite yields at some of their lowest rates since the 1960s nor by credit concerns and headline bankruptcy filings. Municipal mutual bond funds added about $50 billion of assets through December 19, the largest amount since 2006, according to Lipper US Fund Flows Data. Some $26 billion flowed out of muni mutual funds in 2011 from fears that state and local government credit quality would deteriorate following the financial crisis and recession beginning in 2008. The outflows were also tied to the prediction in late 2010 by Bank Analyst Meredith Whitney of “hundreds of billions” of muni defaults that would occur within a year. As documented numerous times in this Commentary, those “billions” in defaults never materialized.
Supply, Demand, and Defaults
Investors seeking a safe haven in 2012 were concerned with Europe’s ongoing debt issues among the “PIGS” (Portugal, Ireland, Greece, Spain) and the potential for significant tax increases in the U.S. As mentioned above, municipal bonds again became a safe haven with demand for municipal bonds again high. Throughout 2012, APA found that lower rated credits and even non-rated deals were often significantly oversubscribed, indicating great investor demand. As investors sought this asset class and issuers took advantage of low interest rates and with refunding issues now “in the money,” issuance increased dramatically in 2012. Bank of America/Merrill Lynch reported issuance in 2012 finished the year with approximately $373 billion, a 29.7% increase from 2011 total issuance of $288 billion. BoA/ML reported that “new money” issuance represented 38.4% of total issuance in 2012 ($144 billion), the lowest absolute level since 1997. “Refunding” issuance however represented 61.6% ($230 billion) of the 2012 total, the highest percentage of total issuance since 1993. Predictions for 2013 vary among market participants from $280 billion to $415 billion.
Municipal demand was also helped by the continuing declines in defaults. Municipal Market Advisors reports that in 2012, 93 issuers defaulted for the first time on approximately $1.7 billion in debt. This is a dramatic decrease from the 129 issuers who defaulted for the first time in 2011 on $6.5 billion in debt and the 140 issuers that defaulted in 2010 on $3.16 billion. JP Morgan reports defaults were 31% lower in 2012 than in 2011 with $908 million of true payment defaults and $1.6 billion in total defaults. JPM also reported that 81% of true payments default and 53% of all defaults were in unrated bonds, though they only represented 6% of total muni debt outstanding. From the literature reviewed by APA, only Bank of America/Merrill Lynch showed an increase in defaults with $2.69 billion entering into debt service default for the first time compared to $2.41 billion (a 7.9% increase) in 2011. However, they also found that the highest percentage of these defaults were in the unrated/special assessments sector (27%), followed by airport bonds (as a result of American Airlines filing for bankruptcy). These are credit sectors APA traditionally avoids.
Treasury Yields: Where are they now? Where were they in 2012?
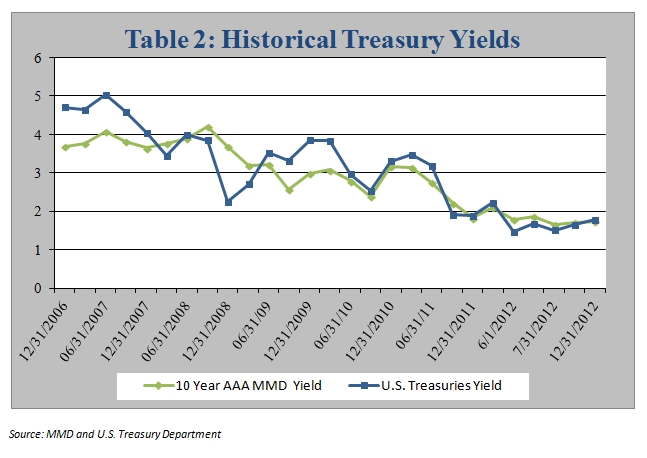
With the continued fiscal and debt issues in Europe, a flight to quality coupled with an investor “yield grab” and tax increase headlines stateside, U.S. Treasury rates continue to remain at all time lows. Treasury yields decreased slightly at years end with 2-year Treasuries at 0.10% on December 5 from 0.11% on November 3 and down from 0.29% on April 11th. The benchmark 10-year note yield has seen recent increases yet remains near historic lows as evidenced by the 1.78% yield on December 31. This was an increase from the November 30 intraday trade at 1.62%. Triple A-rated muni bond “spreads” to comparable Treasures hit one of their highest ratios since 2007 at 121% on June 1, 2012. Current spreads are 97.8% as of December 31, 2012, with the historic spread average at 85%. A ratio over 100 means that munis are less expensive relative to Treasuries.

Source: MMD and U.S. Treasury Department
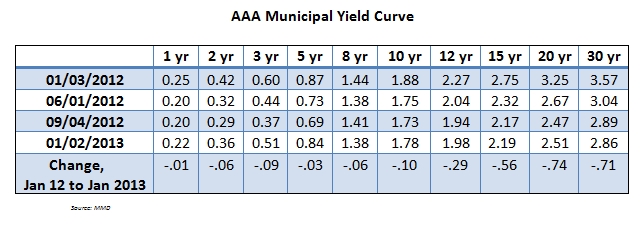
The yield on the 10 year AAA muni also showed declines through the year. The January 2, 2013 yield of 1.78% was 10 bps below the January 1, 2012 yield of 1.88%.

APA’s 2013 Strategic Direction
APA’s Investment Committee believes the best strategy in today’s market environment is a modified barbell strategy. A sample portfolio consists of high quality bonds, half with a 1 to 5 year maturity and half with an 8 to 12 year maturity. APA’s overall duration target is 4 to 4.5 years. To help enhance clients’ portfolio yield, APA invests up to 20% of the total portfolio within the A-rated category. More specifically:
- For investors with a lower risk tolerance, APA recommends a Short-Term Strategy. We feel that lower duration and higher credit quality bonds offer clients a defensive position against rising interest rates. We recommend this strategy to investors seeking principal protection in a rising rate environment while looking for higher returns compared to traditional money market funds. APA tailors this portfolio for each client based on their individual liquidity and future cash flow needs.
- For investors seeking slightly higher yields at lower risk than longer duration bonds, APA recommends an Intermediate Strategy. With a slightly longer duration than APA’s Short-Term Strategy, bonds are selected utilizing a modified barbell investment approach targeting bonds with 1 to 12 year maturities. We also increase our A rated bond holdings in these portfolios from 10% to 20%.
As we do not see any significant near-term threat from inflation, the Investment Committee believes that subtle improvements in the current economy could benefit investors buying along this curve. As stated, our overall duration target is now in the 4 to 4.5 year range. The top five municipal bond sectors in our Intermediate Strategy typically include local general obligation bonds (GOs), higher education, “other revenue”, state GOs, and utility bonds. - For investors with a higher risk tolerance seeking higher yields and attractive after tax returns, APA recommends our High Income Strategy which attempts to provide a higher return with exemption from federal income taxes. The bonds purchased in these portfolios have a longer duration, lower credit ratings and longer maturities. The top sectors in this strategy typically include the following: hospitals, life care, higher education, multi-family housing and appropriations.
- For all of the strategies detailed above, APA recommends investors allocate a portion of their portfolios to out-of-state bonds, even in high-tax states, in order to increase geographical diversification and help mitigate concentration risk. Currently, investors may take advantage of a municipal yield curve that has flattened slightly but remains steep overall to lessen the tax effect on out-of-state bonds by extending maturities a year or two out.
- Additionally, we believe that APA is well positioned to capture higher yields by investing in market sectors where credit spreads remain wider than historical averages. For example, we emphasize purchases of single A-rated issues, water & sewer bonds, highly rated hospital bonds, public power authorities and public school district debt in states offering an “intercept” program which can strategically bolster diversification and price stability.

Connect With Us