Categories
Archives
| M | T | W | T | F | S | S |
|---|---|---|---|---|---|---|
| 1 | ||||||
| 2 | 3 | 4 | 5 | 6 | 7 | 8 |
| 9 | 10 | 11 | 12 | 13 | 14 | 15 |
| 16 | 17 | 18 | 19 | 20 | 21 | 22 |
| 23 | 24 | 25 | 26 | 27 | 28 | |
Commentaries
APA July Market Commentary
By: admin / July 11th, 2013
After one of the most volatile months in recent muni market history, we begin our July commentary with a focus on the trading market. APA remains committed on finding opportunity in times of volatility and advises clients to remain calm during periods of market turbulence.
TRADING MARKETS
“Economics is a highly sophisticated field of thought that is superb at explaining to policymakers precisely why the choices they made in the past were wrong. About the future, not so much.”
– Chairman Ben S. Bernanke from his commencement address at
Princeton University on June 2, 2013.
Perhaps if the market spent as much time analyzing Bernanke’s commencement addresses as they did his congressional testimony, we may have seen a calmer, more rational market in June. Instead, municipals saw the largest 40 day loss period since 1982 according to MMA. Comments from Ben Bernanke that the Fed may consider winding down the Quantitative Easing (QE3) program led to wild speculation that the Fed would actually begin winding down the program as early as September. This led to another 50 basis point spike in treasuries, a volatile trading environment and several delayed primary offerings in the muni market. The concurrent selloff in munis was largely driven by the municipal bond fund outflows, with investor redemptions causing the funds to liquidate large positions and leading to illiquidity and price reductions in the market.
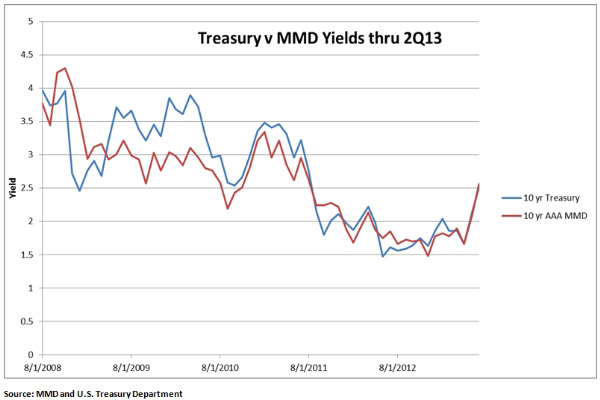
As the month drew to a close, new employment data was released which the market widely interpreted positively as the US economy added 195,000 new jobs in June versus the expected consensus of 165,000. The unemployment rate remained flat at 7.6% from the previous month. Despite reports that these numbers are inflated, the Treasury market rallied again and the 10 Year US Treasury bond ended the month yielding 2.73, a level not seen since August of 2011.
Municipals yields also jumped 50 basis point to end the month with the 10 Year AAA Municipal scale at 2.66 as of 7/8/2013. This was 100+ basis point increase from this time last year and also brought the MMD back to levels not seen since the summer of 2011. (See yield chart below.)

Fundamentally Speaking
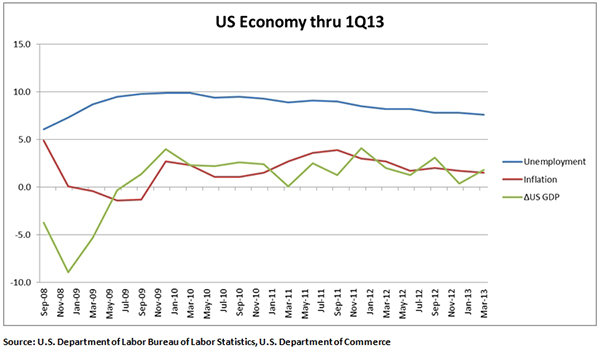
Further, it should be stated that we believe the increase in rates was not driven by fundamental economic indicators. Inflation is still a low 1.4% and the revised GDP for the first quarter was 1.8% versus the estimated 2.4%. According to the US Department of Labor June Employment report, 195,000 jobs were added while the unemployment rate has remained virtually unchanged since February (at 7.6%) and the number of long-term unemployed (accounting for 36% of total unemployed) remained unchanged at 4.3 million. Additionally, the number of persons employed involuntarily on a part-time basis increased by 322,000 while the number of discouraged workers (people who have given up seeking full time employment) increased to 1 million (a 206,000 increase from June 2012). We believe all of this data points to an artificially low unemployment rate. High unemployment and low growth are not fundamentals of a robust recovering US Economy.

CREDIT MARKETS
Market Volatility Not Driven By Credit Concerns
It should be noted that APA feels the volatility in the municipal market was not driven by credit concerns. This is illustrated by the fact that the state of Illinois brought to market a deal that was 7x oversubscribed. California had an equally successful offering for its GO bonds. That said, we continue to be diligent and prudent about our credit choices. Below are three credit stories we are watching that could possibly have a larger implication on the muni market.
Detroit seems likely to be headed toward filing for Chapter 9 bankruptcy sometime in July as the Emergency Manager, Kevyn Orr, released a proposed restructuring plan that seeks significant concessions from bond-holders. Additionally, the city of Detroit defaulted in June when it failed to make its $39.7 million pension obligation certificate payment. Further, under the current plan, Orr has proposed that General Obligation debt should be treated the same as other debt service obligations of the city. This would be an unprecedented way to view General Obligation debt in bankruptcy proceedings.
Philadelphia Schools made headlines this month as they passed a budget with draconian budgetary cuts. The district eliminated all supporting roles such as aides, counselors, nurses, secretaries and security monitors. Additionally, the district laid off all assistant principals and 646 teachers, leading to 3,783 laid off staff members in total. There is also no money in the budget for student books or paper. These measures were some of the most drastic taken by a large district in the face of budgetary pressures. State aid to Philadelphia schools has declined by $274 million in the past three years and has left the city scrambling to find funds for the school district.
Finally, Moody’s released a report on state Pension Plans which looked at pension obligations relative to government revenue in order to reflect the burden of the plans on the current budgets. For the first time, a rating agency went beyond relying on state assumption of returns to analyze the burden of a pension system on a state. Moody’s compiled the assumed discount rates of state pension systems (typically 7-8%) and then adjusted them down to 4-5% depending on the state. The results increased pension burdens which they then looked at as a percentage of state revenues. Below we list the top 5 best and 5 worst funded states under Moody’s new analysis. Additionally, based on the adjustments overall funding ratios of state pension systems dropped from 74% to 48%, confirming that most systems in the US are using rates of returns that are less than conservative.

Disclosures:
Past performance is not indicative of future results. This material is not financial advice or an offer to sell any product. The actual characteristics with respect to any particular client account will vary based on a number of factors including but not limited to: (i) the size of the account; (ii) investment restrictions applicable to the account, if any; and (iii) market exigencies at the time of investment. Asset Preservation Advisors, Inc. reserves the right to modify its current investment strategies and techniques based on changing market dynamics or client needs. This is not a recommendation to buy or sell a particular security. There is no assurance that any securities discussed herein will remain in an account’s portfolio at the time you receive this report or that securities sold have not been repurchased. The securities discussed may not represent an account’s entire portfolio and in the aggregate may represent only a small percentage of an account’s portfolio holdings. It should not be assumed that any of the securities transactions, holdings or sectors discussed were or will prove to be profitable, or that the investment recommendations or decisions we make in the future will be profitable or will equal the investment performance of the securities discussed herein.
APA is an investment adviser registered with the U.S. Securities and Exchange Commission. Registration does not imply a certain level of skill of training. More information about the advisor including its investment strategies and objectives can be obtained by visiting www.assetpreservationadvisors.com. A copy of APA’s disclosure statement (Part 2 of Form ADV) is available without charge upon request. Our Form ADV contains information regarding our Firm’s business practices and the backgrounds of our key personnel. Please contact APA at 404-261-1333 if you would like to receive this information. APA-13-179

Connect With Us